There are mainly two broad categories under which all trading techniques fall, one is called technical analysis and the
other fundamental analysis. Fundamental analysis is used to determine the intrinsic value of a stock, analysing the fundamentals of a stock
(think long term invesotors here the likes of Buffet..)
While technical analysis is used to determine mainly the right time to enter and exit the market. Though almost all good traders use both
techniques to decide their trades.
In technical analysis, a candlestick pattern is a movement in prices shown graphically
on a candlestick chart that some believe can predict a particular market movement. This technique was first known to be used
by rice traders in Japan.
The recognition of the pattern is subjective and programs that are used for charting have to rely on predefined rules
to match the pattern. There are 42 recognised patterns that can be split into simple and complex patterns. We will have a look
at a few simple ones here.
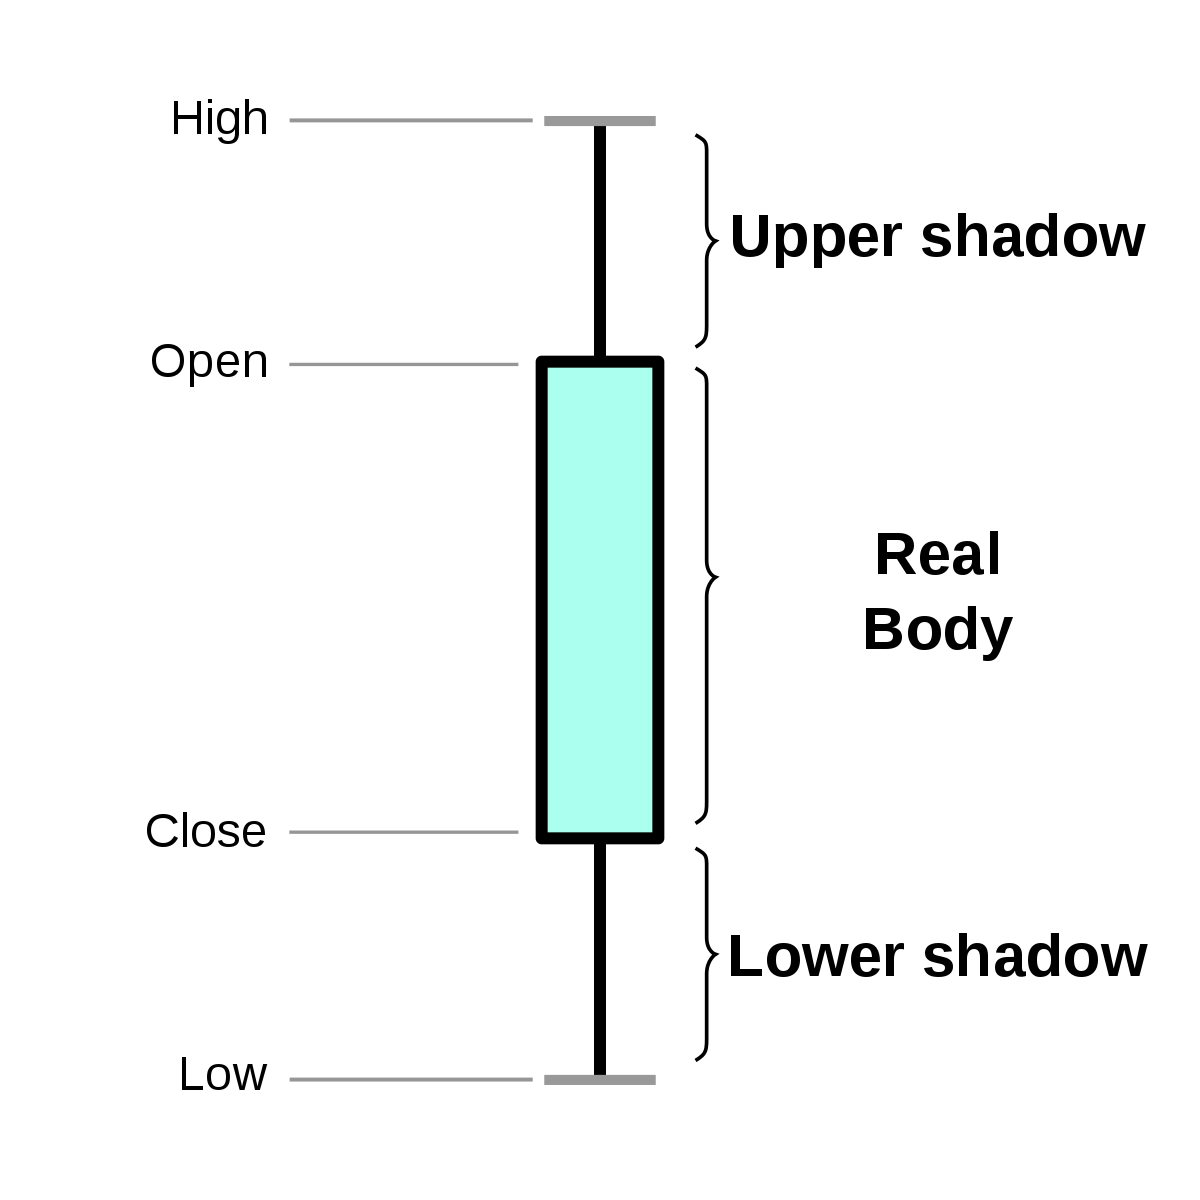
From the diagram you can probably guess why the name "candlestick".
This is the layout of a candle stick. Four points are used to construct any candlestick namely,
open (price at which the stock opened), close (final price at closing of day), high (highest price the stock reached)
and low (lowest price the stock touched). There are 4 parts, the upper shadow, real body and the lower shadow.
Upper shadow is the distance between high and open while lower shadow is the distance between low and close.
Next up we will see, how the value of the four points relative to each other give us the two primary categories of sticks.
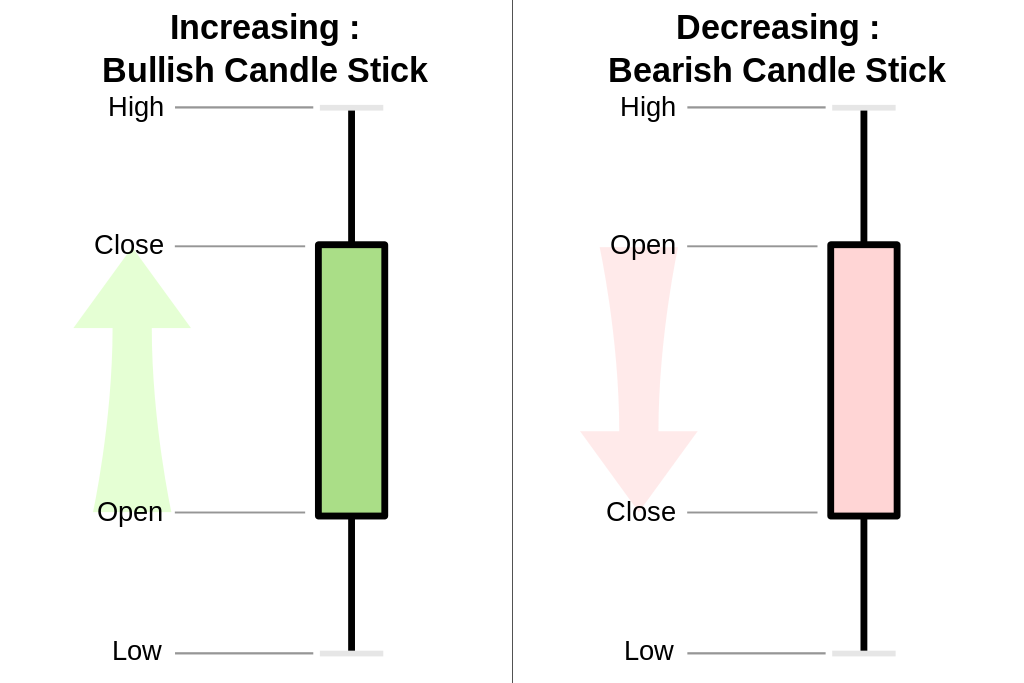
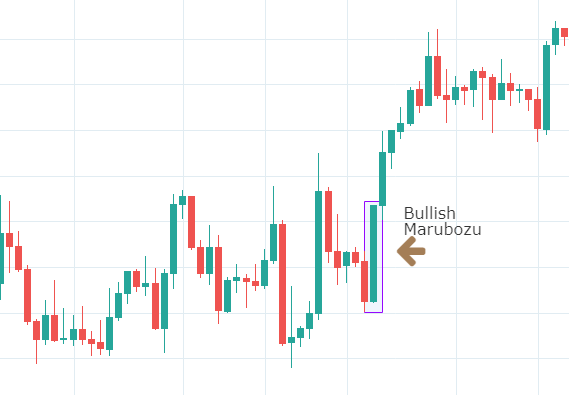
There may be multiple "patterns" formed by candlesticks but they in themselves are only of two types primarily. A bullish candlestick or a bearish one. A bullish stick denotes the trend for the particular stock was positive and the selling was dominant. On the other hand a bearish sticks shows that the trend is negative, i.e there are more sellers of the stock than buyers. A bullish stick is genrally depicted by a green color body and a bearish ones by red body. A marubozu is the simplest candlestick patten formed when the open and high/low point and the close and high/low point are almost same (basically a stick with negligible shadows).
Perhaps at this time it's also important to know that we can have candlesticks of any time duration from daily charts to even one minute charts. Next we will look into some actual patterns formed by candlesticks.
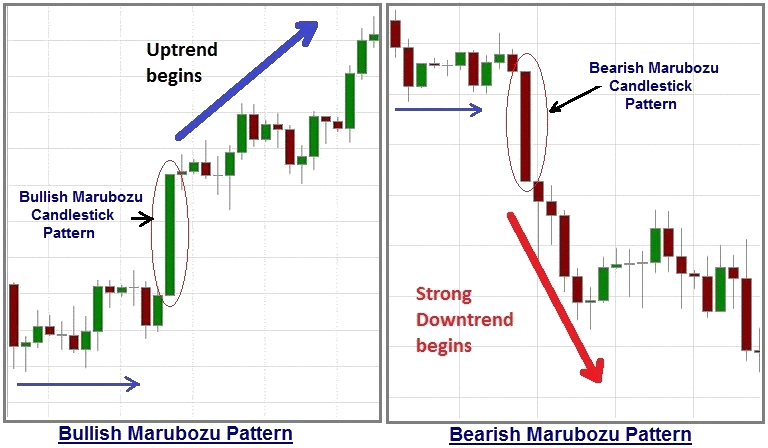
Shown in the diagram here are two different patterns, a 'bullish marubozu' emerges in the left side image and a 'bearish marubozu'
seems to be formed in the right side image. But what exactly can we infer from these patterns?
From what our understanding have been of candlesticks, we know that the four points of the stick namely open, high, close and low
provided us valuable insights about how the market behaved.
Now if we consider the patter of marubozu again and notice that here the open and low are almost the same and close and high are
also equal (for bullish marubozu, for bearish it is opposite, i.e open same as high and close same as low). That means throught the
duration of day (supposing it's a daily chart, we are looking at) the stock was bought heavily and surely at the close of day
there was high buying trend and hence it closed at it's highest point.
Now think, what insight does this give to us? Next morning when the market reopens, what would be market trend?
Well, the answer to question asked in previous slide is that the trend will continue, think again if there was so much buying going on
throughout the day that the stick kept on increasing it's length and closed at it's high, it's a good chance that buyers are still not
satitated enough and the buying is likely to continue (these cases happen when there is a very good news about some stock in the market
let's say recently "Facebook" decided to purchase a part of "Reliance Jio", definetely this news led to a buying surge of the reliance stock.)
Similarly, a bearish marubuzo signifies a downward trend or the sellers market.
Fun Fact: Marubozu is a japanese term which means a bald or shaved head!